Complex Function Graphs
|
|
|
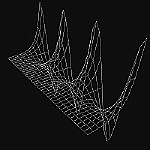
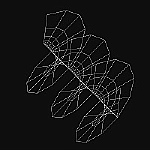
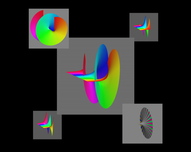
Graphs of the real part of the exponential function and the imaginary part of the logarithm, together with a "tetraview" for the exponential function.
This film treats graphs of complex functions w = f(z) considered as parametric surfaces (x,y,u,v) in 4-space, where z = x + iy and w = u + iv. In each case orthographic projection into (x,y,u) is used to get the graph of the real part of w, then rotation in the uv plane gives (x,y,v), the graph of the imaginary part of w. Rotating the original graph in the xv plane leads to (y,u,v), the graph of the imaginary part of the inverse function of f. Finally, projection to (x,u,v) gives the graph of the real part of the inverse function.A particularly interesting example is the exponential function w = ez with the inverse relation z = log(w). The graph is given by (x,y,excos(y),exsin(y)) in 4-space. Projection to (x,y,u) gives the real part of the exponential. The projection (y,u,v) gives a right helicoid which represents the imaginary part of the Riemann surface for the logarithm. The projection (x,u,v) gives a surface of revolution of a real exponential function as the real part of the logarithm [3].
Color certainly is a considerable help in analyzing these objects. Coloring the axes and displaying a coordinate frame during rotations is a very effective way of keeping track of positions in real four-dimensional space. The authors have devised other methods for displaying complex function graphs, both of which have played central roles in expositions of art and mathematics, most recently in Lisbon [16].
A method with promise is the "tetraview", a way of displaying the real and imaginary parts of a function and its inverse relation in such a way that we can see the deformation from any position to any other by selecting edges in the one-skeleton of a tetrahedron whose vertices represent the four main projections from 4-space. We can also consider the intermediate position at the barycenter of the tetrahedron, the average of the four extreme views.
The Gauss Map, A Dynamical Approach